
From September 2024, schools will need to be able to track the number of sessions (half days) of unauthorized absence in a rolling period of 10 school weeks. This period of 10 weeks can span holidays and academic years. The Department for Education is coming at this from the perspective of a threshold measure for a “potential” fine. Stepping away from that discussion though it is an interesting way of monitoring a students attendance and identifying trends over time.
In this article we’ll look at how we model attendance data and then show one option for calculating absence in a 10 week rolling window.
The Data Model
There are two schools of thought on attendance data in Power BI. One looks at aggregating data before you get to Power BI and just using it as a tool to view the results, the other hands the finest grain data to Power BI and lets its engine do the work. I’m a big fan of the second approach as long as the data is loaded via a “long and thin” fact table with relevant dimensions around it in a star schema. In this setup Power BIs, Vertipaq engine really comes into it’s own and allows for really dynamic interrogation of the data.
Our model is structured like this:
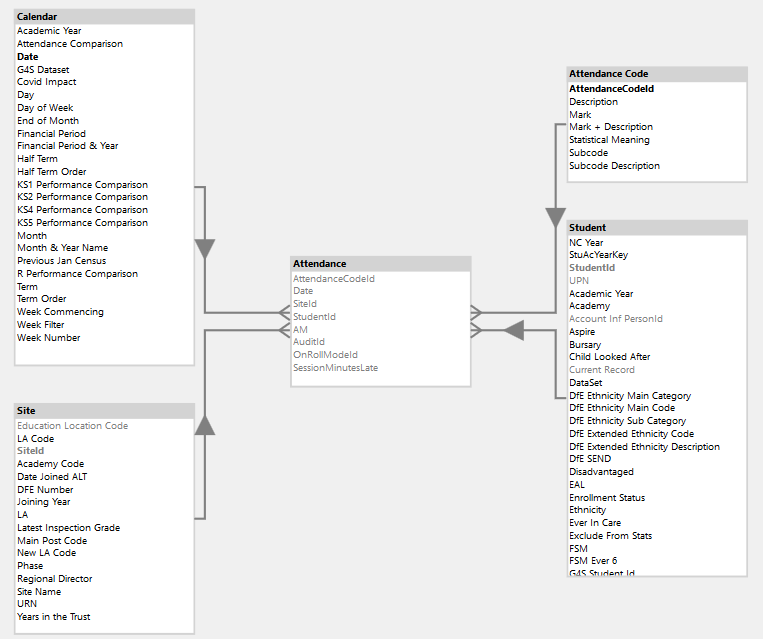
The attendance fact table in the middle contains only dates and integer surrogate keys:
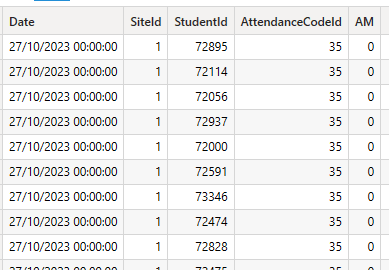
Surrounded by dimensions that describe the academy, the student, the date and the session mark.
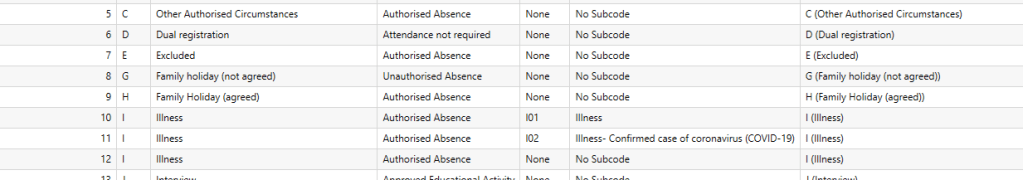
The Attendance Code dimension has one row per DfE Subcode:
As discussed in a previous article our student dimension has one row per student per academic year which we’ll need to handle carefully in this calculation.
Finally the date table contains a “Week Commencing” column which will come heavily into play for this calculation.
Basic Building Blocks
For a given student we need to be able to identify which weeks attendance is expected. For this a basic measure that returns the number of possible sessions is needed:
# Attendance Possible =
CALCULATE(
    COUNTROWS( Attendance ),
    NOT 'Attendance Code'[Statistical Meaning] IN
        { "No mark", "Attendance not required" }
)
We also need a basic measure that returns the number of session of unauthorised absence:
# Attendance Unauthorised Absence =
CALCULATE(
    COUNTROWS( Attendance ),
    'Attendance Code'[Statistical Meaning] = "Unauthorised Absence"
)
Building our final measure
The intention is to use this measure either in a table visual with each student on a row where a “Current Week” has been selected or to have selected a student and view the trend week by week to identify if they are getting close to the or further away from the threshold.
First we need to get the selected students UPN (so we can bridge academic years from our student table – you may not need this) and get the selected week commencing:
VAR _VisibleStudentUPNs = VALUES ( Student[UPN] )
VAR _ReferenceWeek = SELECTEDVALUE ( 'Calendar'[Week Commencing] )
Next we need a virtual table with one row per “week commencing” from our date table that occur in or before the selected “Reference Week”:
VAR _AllWeeks =
    CALCULATETABLE (
        VALUES ( 'Calendar'[Week Commencing] ),
        REMOVEFILTERS ( 'Calendar' ),
        'Calendar'[Week Commencing] <= _ReferenceWeek
    )
Working in a multi academy trust or even a single academy you may find that not all students have the same “possible weeks”, if you consider either different term dates, phased starts or mid year joiners. So for the selected student we need a list of 10 week commencing dates where they actually could have attended:
VAR _ActiveWeeks =
    TOPN (
        10,
        FILTER (
            _AllWeeks,
            CALCULATE (
            	[# Attendance Possible],
            	REMOVEFILTERS ( 'Calendar' )
            ) > 0
        ),
        'Calendar'[Week Commencing]
    )
All this is doing is iterating over the list of all possible week commencing dates, getting rid of any with no possible attendance and then selecting the 10 most recent. It’s an interesting example of what Calculate does; here it removes any external filter from calendar but then forces a context transition and moves the week from the current row into the filter context.
Finally we take all of these pieces and return a value using:
RETURN
    CALCULATE (
        [# Attendance Unauthorised Absence],
        _ActiveWeeks,
        _VisibleStudentUPNs,
        REMOVEFILTERS ( Student )
    )
Removing any filter context from the Student dimension then lets us put back our selected UPN (calculate loves a table as a filter!). This let’s us jump the academic year barrier imposed by our slowly changing dimension.
We also apply the _ActiveWeeks table as a filter. In this case we don’t need to explicitly remove the filter on the date table because that is done for us by the engine because it’s marked as a date table.
The complete final measure looks like:
Sessions Missed Rolling 10 Weeks =
VAR _VisibleStudentUPNs = VALUES ( Student[UPN] )
VAR _ReferenceWeek = SELECTEDVALUE ( 'Calendar'[Week Commencing] )
VAR _AllWeeks =
    CALCULATETABLE (
        VALUES ( 'Calendar'[Week Commencing] ),
        REMOVEFILTERS ( 'Calendar' ),
        'Calendar'[Week Commencing] <= _ReferenceWeek
    )
VAR _ActiveWeeks =
    TOPN (
        10,
        FILTER (
            _AllWeeks,
            CALCULATE (
            	[# Attendance Possible],
            	REMOVEFILTERS ( 'Calendar' )
            ) > 0
        ),
        'Calendar'[Week Commencing]
    )

RETURN
    CALCULATE (
        [# Attendance Unauthorised Absence],
        _ActiveWeeks,
        _VisibleStudentUPNs,
        REMOVEFILTERS ( Student )
    )
Example Outputs
Dropping the measure into a table visual with student names gives you a quick overview of the current position:
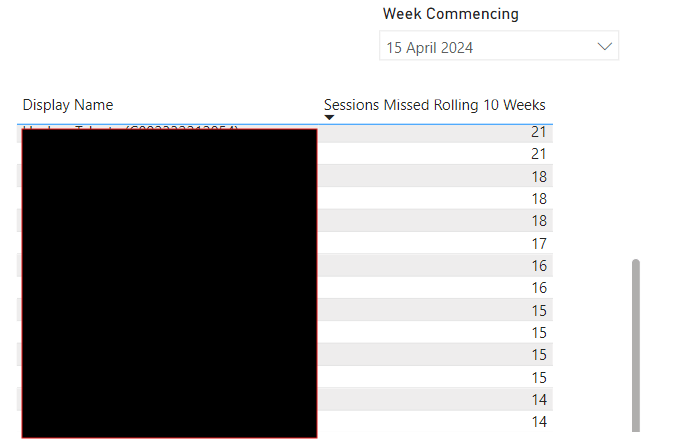
Rendering this for an entire year group took 0.3s (yours may be quicker as our model is setup to only show student names via a setup involving RLS and a calculation group).
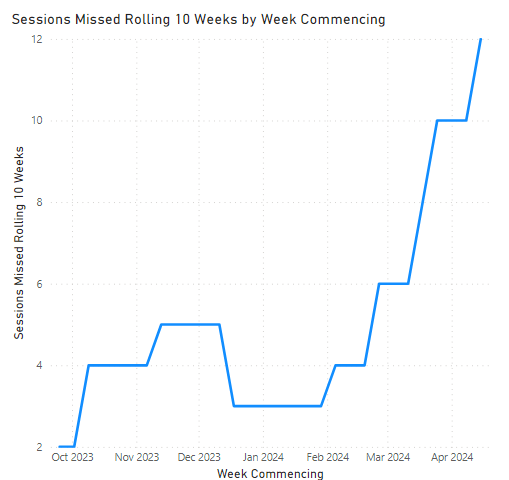
With a student selected, because the measure is dynamic and not pre-aggregated when the model is loaded, you can see how this changes over time. In the below example the selected student had been missing around 3-5 sessions in the rolling 10 week windows up until the middle of February when clearly “something changed”:

Hi Ben
Thanks for putting this out there. I’ve been able to get the measure to produce a number, based from a reference week, however, the number of Unathorised Absences I am getting reported is less than it should be. It seems that the 10 week countback is ignoring weeks where there is no possible attendance, i.e. holidays. Any suggestions asto why this may be? Bromcom is the MIS for our MAT if that helps. I have pulled up a table of week commencing and total possible attendnaces for the week and the holiday weeks don;t show up, so definitely not an issue with rogue possibles in those weeks. Any help appreciated.
Thanks,
Mark
LikeLike
Hi Mark, away from a computer at moment. It is ignoring weeks with no possible attendance by design which was my reading of the dfe guidance. Eg first week back in September includes last 9 weeks from previous year where available. Not sure why that would be resulting in it being less than it should be. Would have to see your data model to understand more.
LikeLike
Hi Ben, sorry I meant to say it’s not ignoring holiday weeks, which is why the total it shows me is less than it should be.
LikeLike