
At Archway Learning Trust we’re about to commence on a large scale infrastructure project with the intention of modernising a number of our source systems. Potentially including a move from on premise educational management information systems to a modern cloud based system. As part of that move the intention is to migrate our existing on premise data warehouse into Microsoft Fabric. I wanted to take this opportunity to share how we currently model some of our data and open a conversation up as to best practice.
Kimball and Conformed Dimensions
Power BI / Fabric works best with stars schema data models as defined by Kimball. If you find yourself writing increasingly complication DAX measures there’s a good chance your data model isn’t setup in an ideal way. We have a set of “standard” shared tables (conformed dimensions) that filter all of our information tables (fact tables).
These conformed dimensions are “Site” (every single one of our source systems seems to refer to locations by different names, this table lets us do a lookup onto a standard name). “Student” (this is the heart of the article and will be discussed in detail later) and “Calendar” (a standard date table with a row per date identifying half terms and terms). To put their use in context some examples follow which are all part of a single enterprise data model. In the following diagrams you can see they form a star around the fact tables. Each fact table has extra dimensions specific to it but we’re just going to focus on the core.
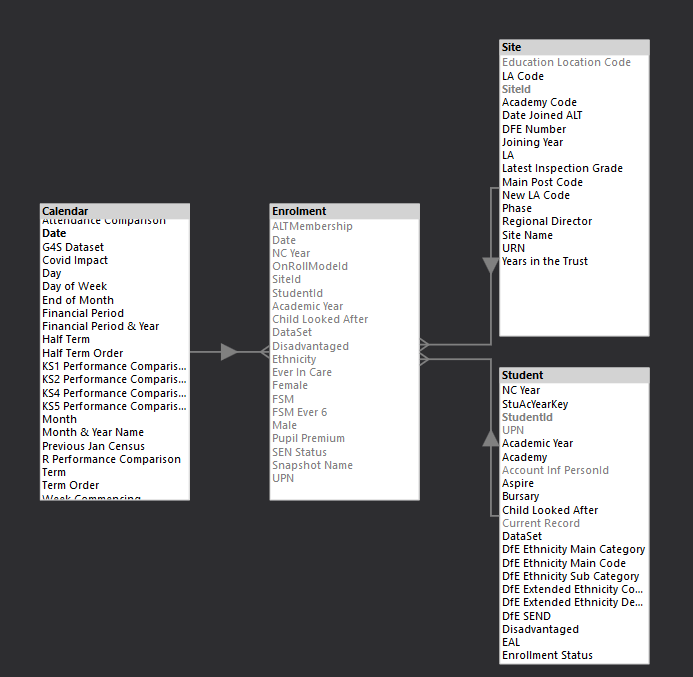
Enrolment
Once a week, a snapshot of students on roll is taken along with their core demographic data at that point and stored in the Enrolment table. This allows us to see student numbers at a point in time utilising the relationship from the calendar table instead of having to write DAX to locate the correct records.
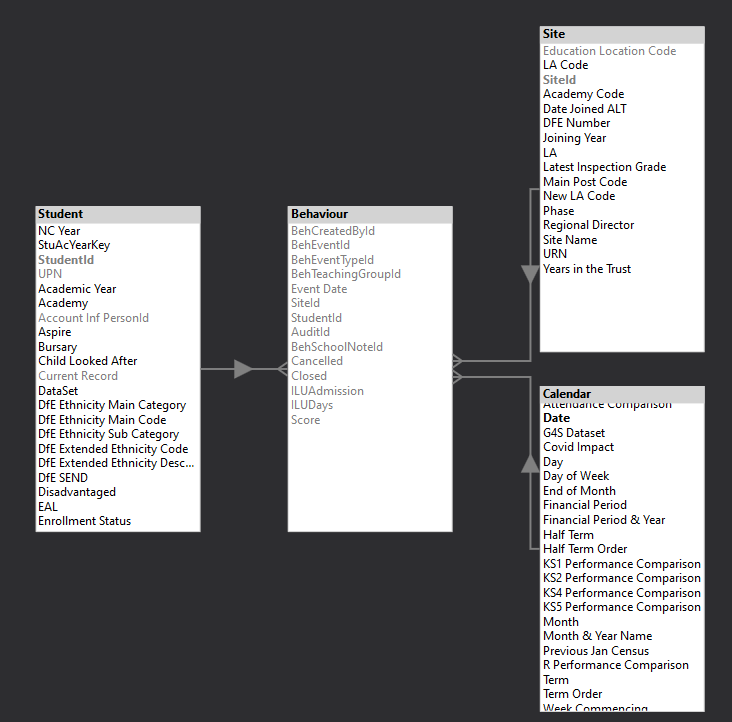
Behaviour
The Behaviour table has a row for every behaviour event recorded in the MIS.
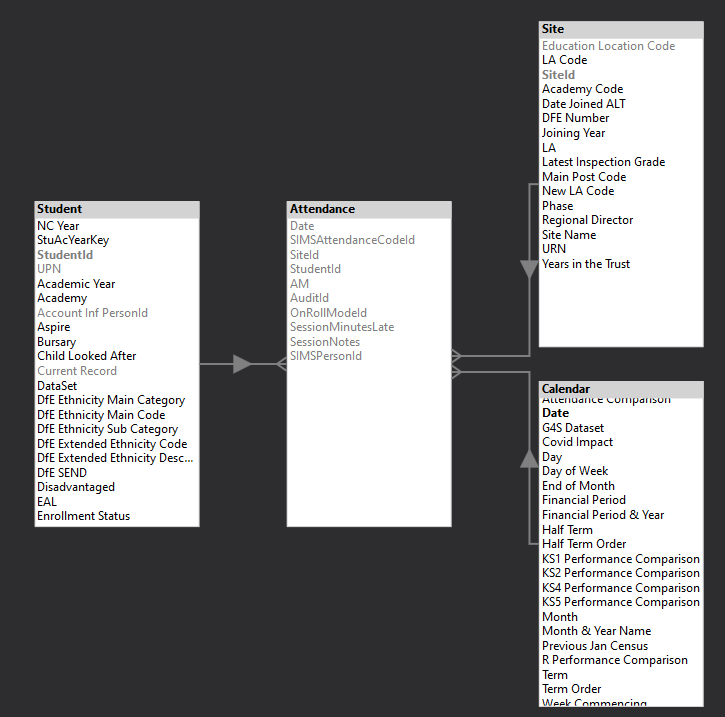
Attendance
The attendance table has a row for every attendance mark (2 per day per student). It is a very long and deliberately thin table. This allows the Power BI Vertipaq engine to run exceptionally quickly.
Slowly Changing Student Dimension
This article is really about how we model Students, I intend to share how we do it but I’m really interested if anyone has a better solution. We need to be able to track student changes over time (as simple as, they move up a year group each year for example). In data modelling this is achieved with slowly changing dimensions. They come in a variety of types (1 to 6). The most common are type 1 where changes are simply overwritten and type 2 where a new row gets added every time a change occurs. For our Student dimension we currently do something in between and add a new row for each student/academy combination (to handle dual reg students) per academic year so it might look something like (with lots more columns):
| StudentId | UPN | Academy | Academic Year | Name | NC Year | SEND |
| 1 | X001 | BAA | 19/20 | Fred | 7 | N |
| 9024 | X001 | BAA | 20/21 | Fred | 8 | K |
| 14234 | X001 | BAA | 21/22 | Fred | 9 | K |
| … |
If a change occurs mid year the current record gets updated but the previous academic years remain unchanged. The same context data is written into the weekly enrollment snapshot table so if we needed to see how something had changed over time at a finer grain than the academic year we could. It also allows us to actively use the date table relationship rather than having to iterate over the student table to identify who was on roll on certain dates. This avoids slower performing DAX that looks like:
VAR SelectedDate = 'Calendar'[Date]

RETURN
	CALCULATE (
	    COUNTROWS ( 'Student' ),
	    'Student'[Start Date] <= SelectedDate
	        && 'Student'[End Date] >= SelectedDate
	)
We now don’t write measure that calculate directly off the student dimension preferring to always calculate from Fact tables.
Handling this in Fabric Notebooks
Currently the above student dimension is produced in an on premise SQL server using SSIS. In preparation for a move to the cloud I’m writing some proof of concept notebooks to handle the engineering. The code for the above dimension is available at:
GitHub – Fabric POC – Student SCD Demo Notebook
To run it:
- You need a workspace running on a Fabric capacity (F2 or trial is fine)
- Create two lakehouses named “LH_Demo_Base” and “LH_Demo_Curated”
- Download the notebook from the above github.
- From the data engineering experience click Import notebook and point it at your local copy.
- Link the notebook to the two lakehouses you’ve just created via the Explorer pane.
As a proof of concept it builds a source table and the dimension table and then runs through some simulated changes including:
- Initial record insert
- In year record changes and insertions
- Academic year roll up
- Records being deleted in year from a source system
What might I change?
The above approach works really well for us and in general keeps DAX measures simple. A little work is needed to track a students entire history across academic years. For example, to see a students lifetime number of suspensions we’d have to write DAX like:
VAR _VisibleUPNs = VALUES( Student[UPN] )

RETURN
	CALCULATE (
		[# Suspensions],
		REMOVEFITLERS ( Student ),
		_VisibleUPNs
	)
With the new guidance on tracking attendance in 10 week rolling windows that can span holidays and academic years we might find we get better performance by having a much simpler type 1 student dimension which has a single row per student and then a context dimension that works like the above.
I’d be very interested in how others are approaching what is a very standard problem in education data. Do reach out if you’d like to discuss.
